Pipeline Report
The San Francisco consolidated pipeline consists of development projects that would add residential units or commercial space, applications for which have been formally submitted to the Planning Department or the Department of Building Inspection (DBI).
Pipeline projects are at various stages of development: from applications having been filed to entitlements secured; from building permits approved and issued to projects under construction (see diagram below). The pipeline includes only those projects with a land use or building permit application. It does not include projects undergoing preliminary Planning Department project review or projections based on area plan analysis. Projects vary in size from single units to larger multi-year development programs undergoing environmental review.
Once a project is issued a Certificate of Final Completion (CFC) by the DBI, it is taken out of the pipeline. When all or a subset of residential units in projects receive a Temporary Certificate of Occupancy (TCO), those units are moved out of pipeline (removed from the “Pipeline Units” field), but projects stay in the pipeline until they receive a CFC.

Data sources for the pipeline are chiefly the project databases maintained by the Planning Department and the Department of Building Inspection, respectively, but data is also occasionally obtained from the Office of Community Investment and Infrastructure (formerly known as Redevelopment Agency).
Changes in Status Definitions
Following changes have been made in status definiens since 2022 Q1 Pipeline Report to align Quarterly Pipeline Reports with other Housing Reports (Housing Inventory and RHNA Annual Progress).
Construction: projects that are authorized for construction deemed to be in the construction stage. A project is considered to be authorized for construction if it has:
- an issued full building permit, or
- an issued site permit with an approved first construction document
Past definition: projects that had their first inspection were deemed to be in the construction stage.
Building Permit Issued: includes projects that have an issued site permit but don’t yet have their first construction document. Housing units These projects are not yet counted toward RHNA progress.
Past definition: included projects with any type of permit (site or full building permit) in the issued status.
The Relevance of the Pipeline
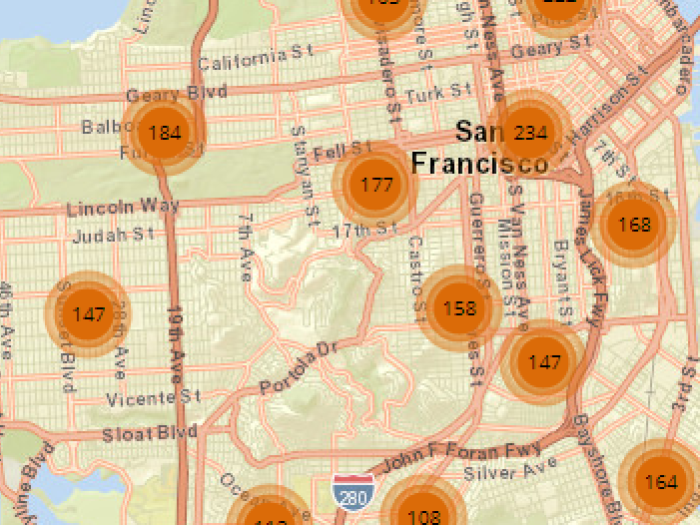
The pipeline serves as a barometer of medium to long-term development trends. It illustrates location and scale of current and proposed future construction taking place and where new land uses (see data dictionary) are being established; it also records demolition and a partial listing of conversion of existing land uses. In sum, the pipeline provides a short- to medium-term picture of changing land uses, tracking especially the changes to the city's housing stock and commercial uses.
Accuracy and Timeliness
The pipeline is compiled and consolidated from different data sources and is subject to errors due to varying accuracy and currency of original sources. The pipeline quarters are as follows:
- Quarter 1 (Q1): January 1 - March 31
- Quarter 2 (Q2): April 1 - June 30
- Quarter 3 (Q3): July 1 - September 30
- Quarter 4 (Q4): October 1 - December 31
The data in this report is pulled from original sources. While we try to consolidate multiple permits for different components of the same project from different agencies, it is not possible to validate the accuracy of all projects.
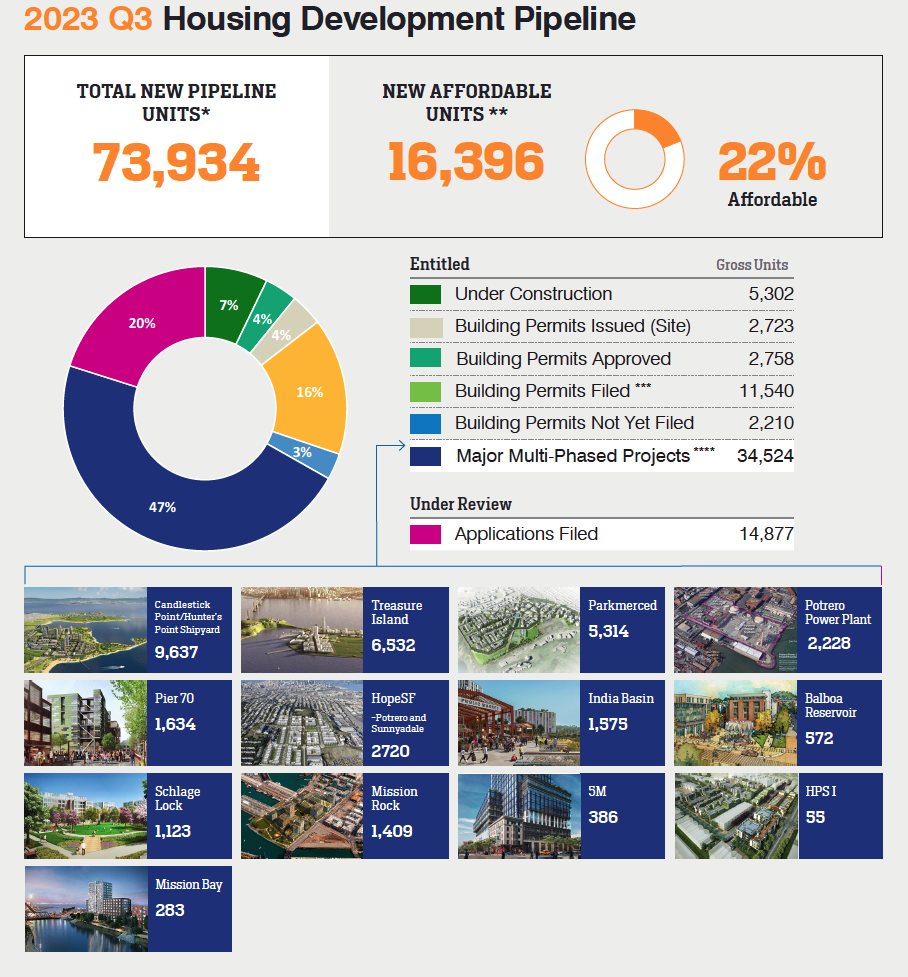
* In addition to units in projects that are 100% affordable or have declared how they are meeting affordability requirements per Sec 415 or other programs, this figure includes an estimate of expected affordable units in 10+ unit projects that haven’t yet declared how they plan on meeting affordability requirements.. Buildings in future phases of Major Multi-Phased Projects (i.e. not yet filed for building permits) are not included in this total count of pipeline affordable units. Actual production of affordable housing 2015-2021 has averaged 30% annually of total housing production.
** Includes only entitled projects. Projects under review by Planning Department with building permits filed but that do not require other types of planning entitlement are included in the “Application Filed” category.
*** Remaining phases of project. This does not include net units in phases that have filed for, or have received, building permits or are under construction.
**** In 2021 Q4 and earlier Pipeline reports, the “Building Permit Approved” category on the infographic included units in both Building Permit Approved and Issued statuses. Since 2022 Q1, Building Permit Approved and Issued have been broken down into two categories.
While a pipeline report may show a ~4% uptick in the total number of affordable units, this is mostly due to two changes in methodology:
- Data clean up and using additional data sources (mainly Affordable Housing Pipeline) to fill-in data gaps on affordable units.
- Adding an estimate for the number of affordable units based on historical data for projects that haven’t yet determined how they will meet their inclusionary affordable housing requirements (e.g., on-site inclusionary units, off-site units, fee payment).
Reporting Update
Significant data and systems improvements are underway to produce a more accurate quarterly pipeline, so the data may change at any time. Weekly and monthly data on Planning Applications and Building Permits can be accessed via the City's Open Data Portal:
- Planning Permits (updated weekly)
- Building Permits (updated weekly)
- Housing Completions (updated monthly)
To download data sets:
- Go to DataSF listing of Pipeline Reports
- Select the desired data set to review the summary
- Select the View button to see the Data set
- Look for the row of colorful buttons (top right)and click on the one labeled Export
- A side menu will appear on the right; select your preferred file format to download
Links will become active when item is posted. Not all sets are available.
For more comprehensive data, visit the SF OpenData catalog.
| Year | Q1 | Q2 | Q3 | Q4 |
|---|---|---|---|---|
| 2023 | Report | Data | Map | Report | Data | Map | Report | Data | Map | Report | Data | Map |
| 2022 | Report | Data | Map | Report | Data | Map | Report | Data | Map | Report | Data | Map |
| 2021 | Report | Data | Map | Report | Data | Map | Report | Data | Map | Report | Data | Map |
| 2020 | Report | Data | Map | Report | Data | Map | Report | Data | Map | Report | Data | Map |
| 2019 | Report | Data | Map | Report | Data | Map | Report | Data | Map | Report | Data | Map |
| 2018 | Report | Data | Map | Report | Data | Map | Report | Data | Map | Report | Data | Map |
| 2017 | Report | Data | Map | Report | Data | Map | Report | Data | Map | Report | Data | Map |
| 2016 | Report | Data | Map | Report | Data | Map | Report | Data | Map | Report | Data | Map |
| 2015 | Report | Data | Map | Report | Data | Map | Report | Data | Map | Report | Data | Map |
| 2014 | Report | Data | Map | Report | Data | Map | Report | Data | Map | Report | Data | Map |
| 2013 | Report | Data | Map | Report | Data | Map | Report | Data | Map | Report | Data | Map |
| 2012 | Report | Data | Map | Report | Data | Map | Report | Data | Map | Report | Data | Map |
| 2011 | Report | Data | Map | Report | Data | Map | Report | Data | Map | Report | Data | Map |
| 2010 | Report | Data | Map | Report | Data | Map | Report | Data | Map | Report | Data | Map |
| 2009 | Report | Data | Map | Report | Data | Map | Report | Data | Map | Report | Data | Map |
| 2008 | Report | Data | Map | Report | Data | Map | Report | Data | Map | Report | Data | Map |
| 2007 | Report | Data | Map | Report | Data | Map | Report | Data | Map | Report | Data | Map |
For archival reports, please refer to the Contact tab.
Ken Qi
Planner
ken.qi@sfgov.org
628.652.7469
Data & Analytics Group
Administration Division